
|
Product Lifecycle Management
|
Food & Beverage
|
Blogs
Posted By:
Federico Fontanella, PMP
QUICK ANSWER |
|
Q: Which grocery items have increased the most in price since COVID-19? Beef has seen the largest grocery price increases since the pandemic: beef roasts are up 73.8%, steaks 57.0%, and ground beef 52.5% from March 2020 to December 2025. Eggs (+51.4%) and coffee round out the top five, each up more than 47%. Overall grocery prices rose 29.4% over the period, and the average U.S. household now spends about $681 per month on groceries. Source: Trace One analysis of U.S. Bureau of Labor Statistics data |
Grocery Store Items That Have Increased Most in Price
What began as a disruption in supply chains during the early stages of COVID-19 quickly evolved into the fastest period of food price increases since the 1970s. From meat and dairy to pantry staples and coffee, Americans faced higher grocery bills across nearly every category and are still feeling the repercussions today. Even as overall inflation has cooled in 2024 and 2025, grocery prices remain elevated—and for many items, these increases have not subsided. For food manufacturers navigating these cost pressures, the ability to rapidly reformulate products, adjust pack sizes, and update cost models across the portfolio is a competitive advantage— and a core capability of Product Lifecycle Management.
Persistent food price inflation has had measurable effects on household budgets and food security. According to the latest data from the U.S. Bureau of Labor Statistics, the price of food at home—groceries purchased for consumption at home—climbed 29.4% between March 2020 and December 2025. These higher food costs have pushed the average monthly household grocery budget to nearly $700. Moreover, the U.S. Department of Agriculture’s Food Price Outlook projects a 2.3% increase in food-at-home prices in 2026, all but confirming that elevated grocery prices are likely to persist.
These household-level pressures reflect deeper economic and policy dynamics. The Federal Reserve has kept interest rates elevated in an effort to anchor inflation expectations and stabilize long-term prices. These borrowing costs affect multiple stages of the food supply chain, from farm production to retail distribution. Meanwhile, trade policy has added further complexity. Tariffs on a range of imported agricultural and processed food products have increased input and wholesale costs. In response, federal policymakers have implemented targeted tariff reductions on certain food categories and introduced legislative proposals aimed at enhancing competition in food retail markets. While the long-term effects remain uncertain, these actions signal efforts to ease inflationary pressure on consumers without reversing broader price stability goals.
Key Findings
- Grocery inflation has outpaced broader inflation since the pandemic began. From March 2020 to December 2025, the Consumer Price Index (CPI) for food at home rose 29.4%, compared to 25.6% for all other items excluding food.
- Beef products have seen the sharpest price increases since the pandemic began. Beef roasts (+73.8%), beef steaks (+57.0%), and ground beef (+52.5%) rank as the top three items with the largest price gains since the pandemic.
- Eggs experienced extreme price volatility. While egg prices rose 51.4% since March 2020, they declined by 13.2% from December 2024 to December 2025, reflecting recent corrections after earlier spikes.
- Mississippi and Hawaii households spend the largest share of their budgets on groceries. Mississippi households allocate 9.3% of total consumer spending to groceries—the highest in the U.S.—followed closely by Hawaii at 9.2%.
-
Average household grocery spending is nearing $700 per month nationally. Households now spend an average of $681 per month on groceries, representing 43.5% of total food spending.
Recent Trends in Food Prices
After increasing at the fastest rate since the 1970s, grocery prices remain at record highs
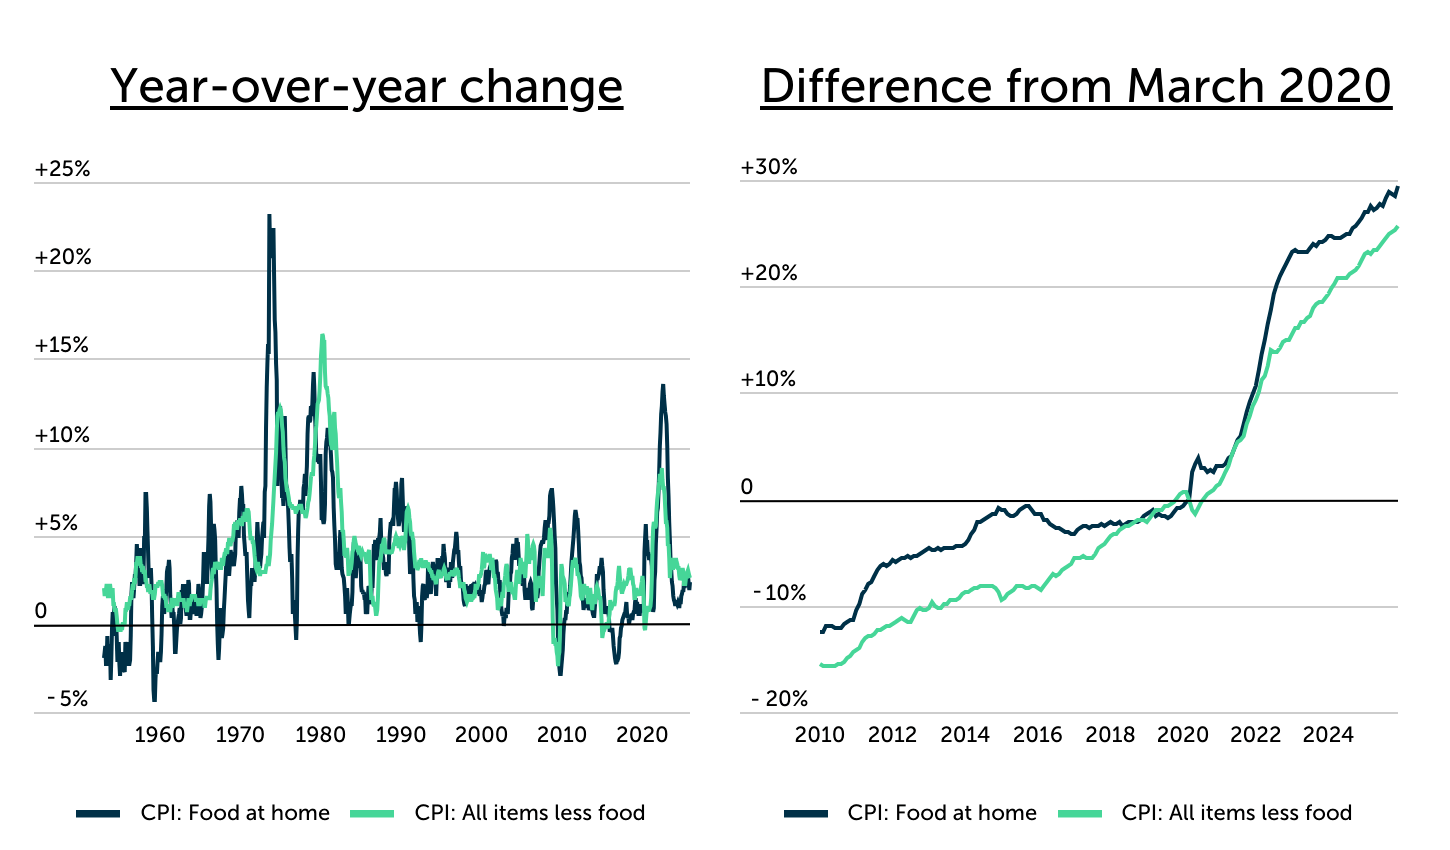
Source: Trace One analysis of U.S. Bureau of Labor Statistics data
After peaking in 2022, grocery price inflation has slowed considerably—but not reversed. From March 2020 to December 2025, prices for food at home rose 29.4%, according to Consumer Price Index data. This long-term increase reflects the sustained inflationary shock that began during the COVID-19 pandemic and continued through global supply chain disruptions, labor shortages, and increased input costs. While the pace of grocery inflation has eased in recent years, prices remain well above pre-pandemic levels.
In 2025, food-at-home prices increased by 2.4% over the 12-month period ending in December 2025, a return to a more historically typical range after years of elevated inflation. Over the same period, prices for all items excluding food rose by 2.6%, indicating that grocery inflation is no longer a primary driver of overall price growth. Still, the cumulative impact of elevated grocery prices has reshaped consumer behavior, with households continuing to adapt to higher food costs through changes in product choices, store preferences, and spending patterns.
DID YOU KNOW?
Food and beverage brands can enjoy wide-ranging benefits by using a Product Lifecycle Management (PLM) system, which helps increase operational efficiency across the product lifecycle, reduce the effort of managing suppliers and vendors, and recoup the cost of retiring legacy software. Learn more about the best PLM software on the market today.

Where Are Households Spending the Most on Groceries?
Households in Mississippi & Hawaii allocate the largest portion of total spending to groceries
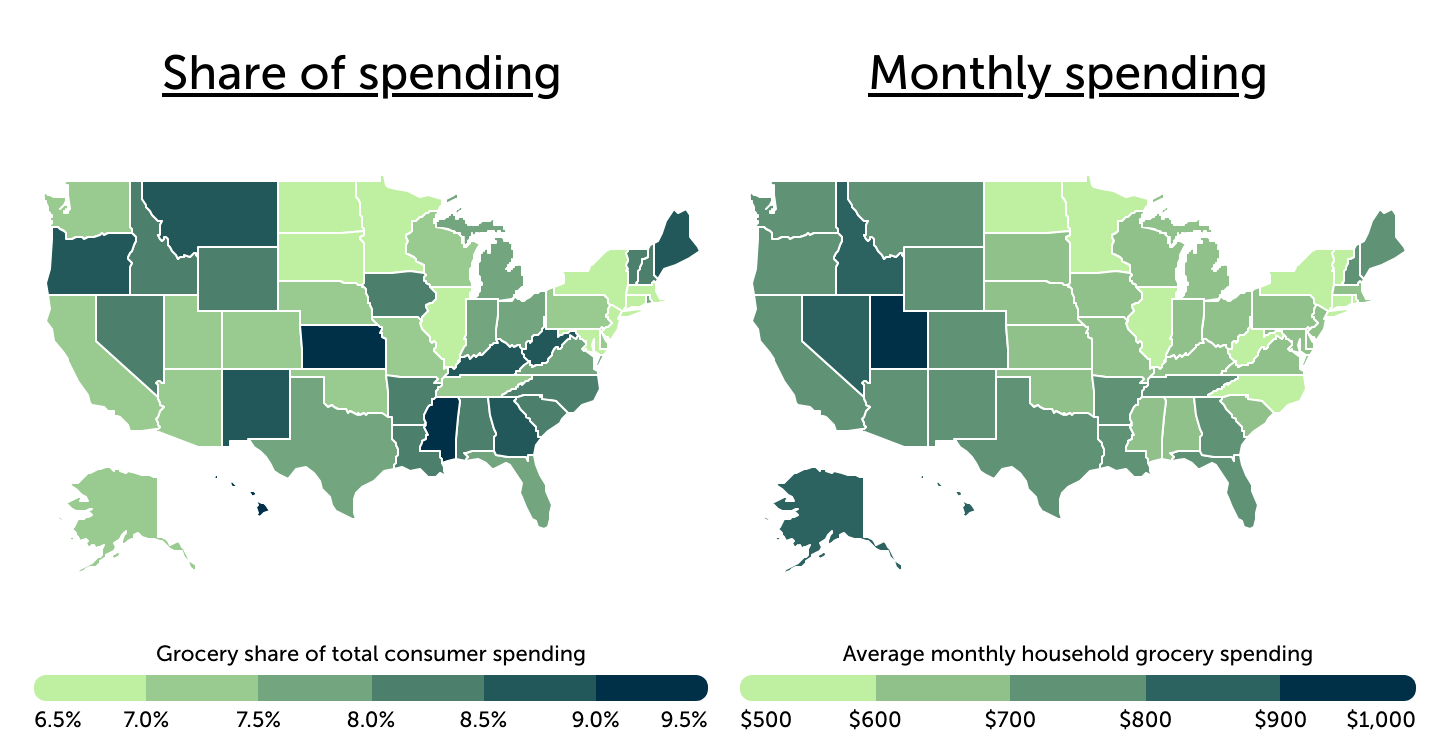
Source: Trace One analysis of U.S. Bureau of Economic Analysis and U.S. Department of Agriculture data
Food purchases represent one of the largest recurring expenses for American households, and as a result, food-at-home prices remain a heavily weighted component in the Consumer Price Index. According to data from the U.S. Bureau of Economic Analysis, groceries account for approximately 7.4% of total household consumer spending nationwide. This share, however, varies across states due to differences in income levels, food prices, and household consumption patterns—making grocery price inflation more burdensome in some areas than others.
Households in Mississippi (9.3%), Hawaii (9.2%), and Kansas (9.0%) dedicate the highest share of their total spending to groceries. In states like Mississippi and Kansas, this stems in part from relatively lower incomes, which make essential expenses like food consume a larger share of total outlays. In Hawaii, the elevated share reflects higher retail food prices driven by geographic isolation and transportation costs. Other states with above-average grocery spending shares include Kentucky, Montana, and West Virginia, all at or above 8.7%.
Even in states where grocery spending represents a smaller share of overall consumption—such as California (7.1%) and Massachusetts (6.7%)—food-at-home expenses still account for hundreds of dollars in monthly costs. Nationally, households spend an average of $681 per month on groceries, with the purchases making up 43.5% of total food spending. Several states exceed this national average by a wide margin: households in Utah ($931), Alaska ($881), and Idaho ($878) report the highest monthly grocery bills in the country. While higher food prices and regional cost-of-living differences play a role, these states also exhibit some of the highest grocery shares of total food spending, suggesting that households in these areas tend to allocate more of their food budgets toward meals prepared at home rather than dining out.
RELATED
Learn more about Trace One's PLM and compliance solutions for food and beverage manufacturers and grocery retailers.

Price Changes for Common Grocery Items
Beef and coffee have experienced the most significant price increases in recent years
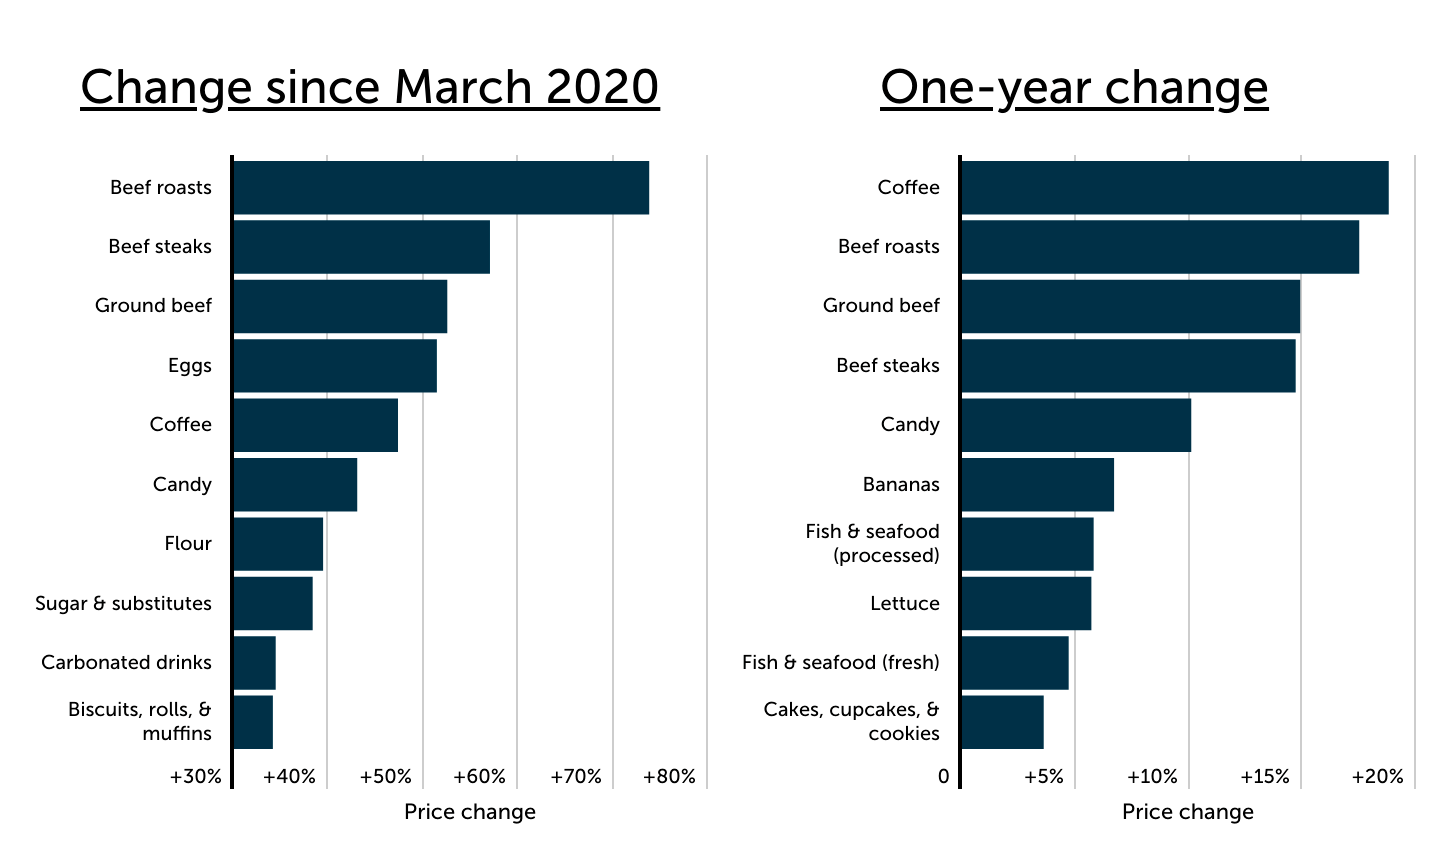
Source: Trace One analysis of U.S. Bureau of Labor Statistics data
While grocery inflation has been widespread, some categories have seen far more dramatic increases than others. Among all food-at-home items, beef products have consistently led price growth since the start of the pandemic. Between March 2020 and December 2025, prices for beef roasts rose by 73.8%, while beef steaks and ground beef climbed 57.0% and 52.5%, respectively. The surge in beef prices is largely due to a historically low U.S. cattle inventory—driven by prolonged drought, high feed costs, and herd liquidation—which has tightened supply and pushed retail prices higher. Eggs and coffee round out the top five, each increasing by more than 47% during the same period.
Over the past year, coffee prices have outpaced all other major grocery items, rising 18.8% from December 2024 to December 2025. According to a Food and Agriculture Organization report, adverse climatic conditions and reduced coffee exports have driven coffee prices to multi‑year highs, with tighter global supply translating into higher costs for roasters and, ultimately, consumers. Candy (+10.1%), bananas (+6.7%), and processed seafood (+5.8%) also saw notable increases over the past year, suggesting that inflationary pressures are persisting across both staples and discretionary items.

Below is a complete breakdown of price changes for 38 of the most popular grocery store items, as well as grocery spending for all 50 states and Washington, D.C. The analysis was conducted by Trace One—a PLM and regulatory compliance software company for the food and beverage sector—using the latest data from the U.S. Bureau of Labor Statistics, U.S. Bureau of Economic Analysis, U.S. Department of Agriculture, and U.S. Census Bureau.
Full Results
Methodology
Data sources include the U.S. Bureau of Labor Statistics’ (BLS) December 2025 Consumer Price Index, U.S. Bureau of Economic Analysis’ (BEA) 2024 Personal Consumption Expenditures by State (released September 2025), and U.S. Department of Agriculture’s (USDA) 2024 Price Expenditure Series, and U.S. Census Bureau’s 2024 American Community Survey.
To determine the grocery store items that increased the most in price, researchers calculated the percentage change in CPI between March 2020 and December 2025 across the most common grocery (food at home) items. Researchers also calculated the one-year, two-year, and three-year change in CPI for those periods ending in December 2025. Grocery items were ranked by largest change in price since March 2020, and in the event of a tie, the grocery item with the larger one-year change in price was ranked higher.
State-level data on grocery spending was sourced from the BEA and USDA. The share of total consumer spending allocated to groceries for each state was calculated by dividing the per-capita spending on food and beverages purchased for off-premises consumption by the total per-capita personal consumption expenditures. The grocery share of total food spending was calculated by dividing the total annual grocery spending by the total annual food spending (food-at-home sales and food-away-from-home sales) for each location. The average monthly household grocery spending, dining out spending, and total food spending were all calculated by taking the total spending figures and dividing by the number of households for each location. Average monthly household grocery spending figures were adjusted to 2025 dollars. States were ranked by the largest grocery share of total consumer spending, and the larger grocery share of total food spending was used to break ties.