
|
Product Lifecycle Management
|
Blogs
Posted By:
Federico Fontanella, PMP
The manufacturing sector is a cornerstone of the U.S. economy, encompassing the production of everything from automobiles and electronics to food and beverages, chemicals, and other consumer goods. By transforming raw materials and components into finished products, manufacturing adds significant value to the economy and supports a vast network of related industries, including energy, construction, logistics, and retail.
In recent years, the sector has faced both challenges and opportunities—ranging from supply chain disruptions and rising input costs to advances in automation, robotics, and reshoring initiatives. Despite these pressures, U.S. manufacturing continues to be a major driver of GDP, employment, and innovation, providing stable, high-quality jobs and fueling exports that help keep the economy globally competitive.
The sections below highlight key statistics on the size, scope, and trends shaping manufacturing in America, with the latest available data on output, employment, and growth across major subsectors.
Key Manufacturing Industry Facts
- Total annual economic output: $7.1 trillion (2024)
- Total annual GDP: $2.9 trillion (2024)
- Manufacturing share of U.S. GDP: 9.8% (2024)
- Total annual exports: $1.6 trillion (2024)
- Total employment: 12.7 million (2024)
- Total number of firms: 397,198 (2024)
U.S. Manufacturing GDP & Growth
Over the past three decades, real GDP from U.S. manufacturing has grown from roughly $1.7 trillion in 1997 to about $2.9 trillion in 2024 (in inflation-adjusted dollars), but manufacturing’s share of overall GDP has steadily declined—from a combined 16% in the late 1990s to just under 10% (9.8%) in 2024. Despite this, manufacturing remains the second-largest contributor to national GDP behind only the real estate, rental, and leasing sector.
Among manufacturing industries, chemical products and food, beverage, and tobacco products remain the largest, followed by computers and electronics, machinery, and transportation equipment. Recent growth has been most robust in petroleum and coal products (up nearly 20% in one year and 22% over ten years) and chemical products, which have also seen strong gains across 1-, 3-, 5-, and 10-year horizons. In contrast, industries like furniture, plastics, printing, metal products, and mineral products have all declined consistently across these time periods.
Gross Domestic Product (Value Added) by Year
Share of U.S. GDP by Year
Simplifying Complex Manufacturing with PLM Software
U.S. manufacturing drives $2.9 trillion in GDP and supports millions of jobs, but managing complex supply chains and product development is increasingly challenging. Trace One helps companies simplify these processes with product lifecycle management software, improving compliance, efficiency, and time-to-market.

Manufacturing GDP Compared
The Largest U.S. Manufacturing Sectors by GDP
Fastest-Growing Manufacturing Sectors by Real GDP Growth
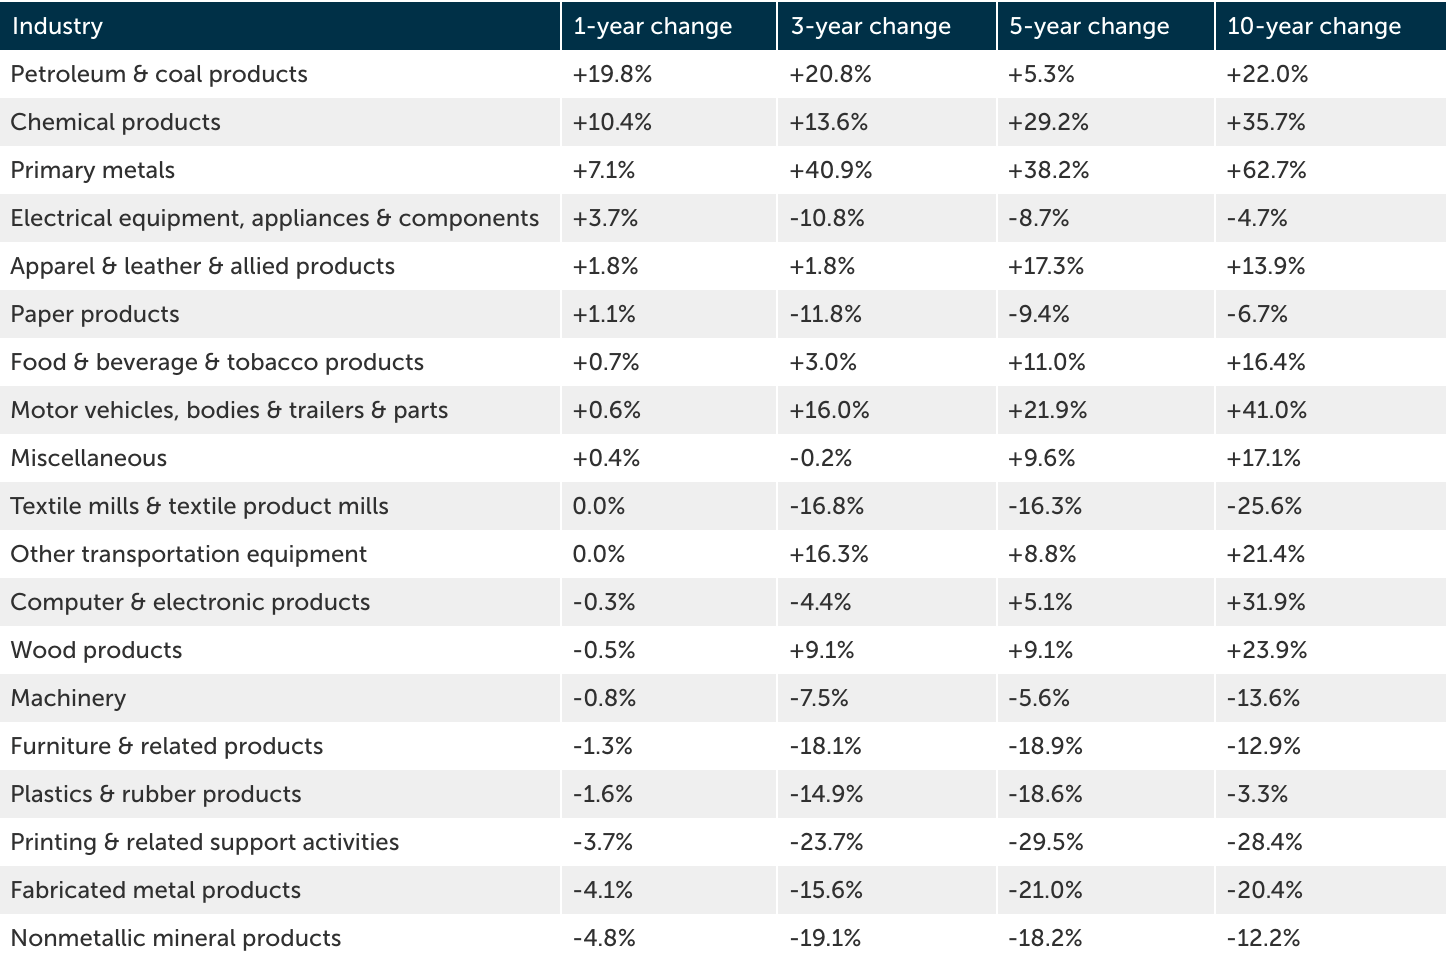
*Percentage change in real GDP
U.S. Manufacturing Export Volume
U.S. manufacturing exports have shown modest real growth over the past 15 years, rising from about $1.58 trillion (inflation-adjusted) in 2010 to roughly $1.65 trillion in 2024, despite a dip during the 2020 pandemic. In nominal terms, exports grew from $1.10 trillion to $1.65 trillion over the same time period.
In 2024, transportation equipment, chemicals, and computer and electronics together account for over half (about 51%) of industry exports, with transportation equipment alone representing 18%.
Manufacturing export markets are highly concentrated, as Canada and Mexico together take in 36% of total U.S. manufacturing exports, dwarfing the next largest markets like China (6%) and Germany (4%). This underscores both a mild upward trend in overall export value and a high degree of sector and geographic concentration.
Total Exports by Year
Annual Exports by Sector
The Largest Importers of U.S. Manufactured Goods
U.S. Manufacturing Employment & Wages
Over the long term, manufacturing employment in the U.S. surged during World War II, reaching over 15 million jobs in the early 1940s, but has since declined steadily to its current 12.7 million, reflecting persistent structural changes in the economy. In recent years, average weekly wages in manufacturing have risen in nominal terms—from around $1,270 in early 2014 to $1,807 by early 2025—but when adjusted for inflation, real wage gains have been modest, with real pay fluctuating around $1,600 to $1,800 per week, suggesting increases are largely in line with cost of living.
While large states like California and Texas report the most manufacturing jobs overall, states such as Indiana and Wisconsin stand out for how concentrated manufacturing jobs are relative to their local economies: Indiana’s economy, for example, relies on manufacturing at more than twice the national average, highlighting regional dependencies on the sector even as national employment remains comparatively flat.
National Employment Trends
Simplifying Product Management in the Food & Beverage Industry
Food, beverage, and tobacco manufacturing continues to expand, contributing billions to the U.S. economy. Keeping up with regulatory requirements and consumer expectations is complex. Trace One’s PLM software for food and beverage helps companies manage compliance, improve processes, and bring innovative products to market faster.

National Wage Trends in Manufacturing
Manufacturing Employment by State
Manufacturing Employment Concentrations by State
Data Sources
- U.S. Bureau of Economic Analysis. GDP by Industry. Available at: https://www.bea.gov/data/gdp/gdp-industry.
- U.S. Bureau of Labor Statistics. Quarterly Census of Employment and Wages (QCEW). Available at: https://www.bls.gov/cew/.
- U.S. Bureau of Labor Statistics. Occupational Employment and Wage Statistics (OEWS). Available at: https://www.bls.gov/oes/.
- U.S. Census Bureau. USA Trade Online. Available at: https://usatrade.census.gov/.