|
Food & Beverage
|
Blogs
Posted By:
Federico Fontanella, PMP
QUICK ANSWER |
|
Q: Which states are drinking less alcohol? Massachusetts has seen the sharpest decline in drinking of any state, down 13.3 percentage points from its peak, followed by Arizona (-12.8) and Maryland (-11.1). Nationally, 51.1% of U.S. adults reported drinking alcohol in 2024, the lowest on record and down from a 56.7% peak in 2014. Utah has the lowest share of adults who drink (31.0%); New Hampshire (61.8%) and Vermont (61.4%) the highest. Source: Trace One analysis of SAMHSA and Google Trends data |
Alcohol consumption in the United States has shifted noticeably in recent years, with a growing share of adults choosing to drink less—or not at all. Public health experts point to a combination of factors driving this trend, including increased awareness of alcohol’s health risks, the expansion of cannabis legalization, and changes in social habits as more young people connect online rather than in person. Shifting cultural norms, a broader focus on wellness, and evolving alcohol beverage labeling requirements have also played a role in reshaping drinking behaviors and consumer choices across the country.
At the same time, the market for alcohol alternatives has expanded rapidly. Internet searches for products such as non-alcoholic beer, zero-proof cocktails, and other alcohol-free beverages have surged, reflecting both consumer curiosity and growing retail availability. Beverage companies have responded by rolling out new product lines and catering to consumers who want the taste and social experience of drinking without the intoxicating effects.
This report, conducted by the PLM and regulatory compliance software company, Trace One, uses data from the Substance Abuse and Mental Health Services Administration (SAMHSA) to examine national-level trends in alcohol use and Google search data to track the rapid rise in online interest for alcohol alternatives. It then compares current alcohol use rates across states and examines how those rates have changed over time. For beverage companies, shifting consumer preferences at this scale mean new formulations, updated nutritional panels, and regulatory filings for low- and no-alcohol alternatives — product development complexity that Product Lifecycle Management platforms are purpose-built to handle.
What Percentage of Americans Drink Alcohol?
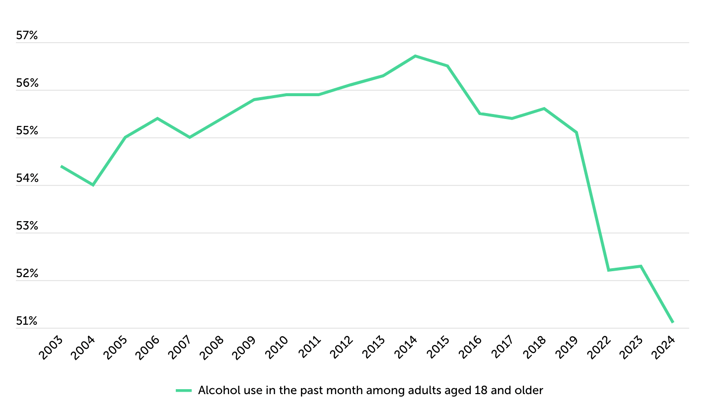
Currently, 51.1% of adults drink alcohol, down from a peak of 56.7% in 2014
Source: Trace One analysis of SAMHSA data
While alcohol may feel ubiquitous depending on one’s social circle or location, just over half of U.S. adults currently report drinking. In 2024—the most recent year of data available—51.1% of adults said they had consumed alcohol in the past month, according to SAMHSA’s State Estimates. This is down 5.6 percentage points from the national peak of 56.7% in 2014.
From 2003 through 2014, the share of adults who drank alcohol edged upward. But since then, the trend has moved steadily downward, with small year-to-year declines through the late 2010s and a more pronounced drop in the early 2020s. By 2024, the national rate had fallen to just 51.1%, the lowest value recorded by SAMHSA and a clear reversal of prior trends.
NAVIGATE COMPLIANCE
Looking to stay ahead of evolving labeling laws and ingredient regulations? Explore how our regulatory compliance software helps food and beverage brands navigate change with confidence.
The Rise of Alcohol Alternatives
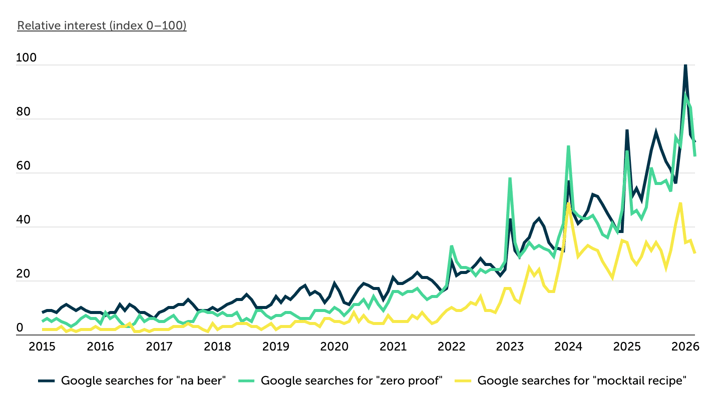
Google searches for non-alcoholic beverages have exploded in recent years
Source: Trace One analysis of Google Trends data
Google Trends search data show that interest in alcohol-free beverages has surged in recent years, transforming a niche market into a mainstream category. Searches for “NA beer”—a product that historically carried a poor reputation—have increased nearly tenfold over the past decade. Meanwhile, searches for “zero proof” drinks and “mocktail recipes” have grown from virtually nonexistent to widely popular, with both terms reaching record highs in recent years.
This surge in consumer interest has reshaped the beverage industry. Athletic Brewing, often credited as a pioneer in the modern non-alcoholic beer market, has built a loyal following by emphasizing flavor and quality on par with traditional craft beer. In response, both large and small breweries have entered the space, offering non-alcoholic versions of flagship beers and developing entirely new alcohol-free product lines.
Major beverage companies have expanded beyond beer into alcohol-free spirits, wines, and ready-to-drink mocktails. Global brands such as Heineken, Guinness, and Budweiser have launched NA versions of their best-known products, while spirits companies have invested in zero-proof gin, whiskey, and tequila alternatives. The growing availability of these products reflects a broader shift: alcohol alternatives are no longer seen as an afterthought for the sober or “designated driver,” but as a legitimate category catering to a much wider audience.
SMARTER PRODUCT DEVELOPMENT
As consumer preferences shift toward wellness and innovation, brands must adapt quickly. Discover how our PLM software for food and beverage helps companies streamline product development and respond faster to evolving market trends
Which States Are Drinking Less Alcohol?
While northern states have higher rates of alcohol use, many have experienced large declines in recent years
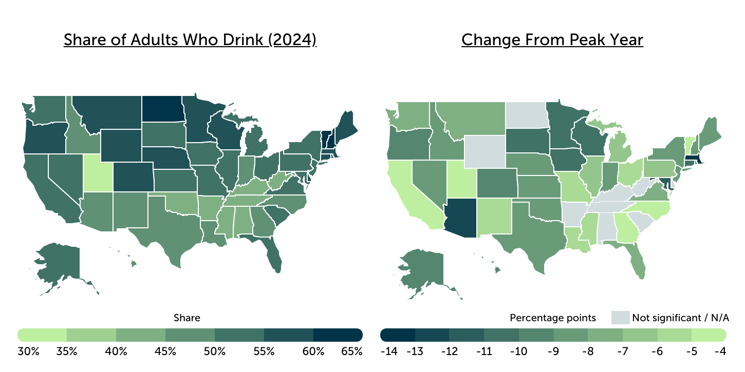
Source: Trace One analysis of SAMHSA data
These shifts in the marketplace are unfolding against a backdrop of notable differences in drinking habits across the country. Alcohol use is generally more prevalent in the northern half of the United States than in the South, a pattern often linked to cultural, historical, and demographic differences. In 2024, the highest shares of adults who drink were found in New Hampshire (61.8%) and Vermont (61.4%), followed by North Dakota (60.8%), Wisconsin (59.5%), Rhode Island (58.9%), and Colorado (58.2%).
Northern states tend to have stronger traditions of beer and spirits consumption, higher rates of social drinking, and, in some cases, fewer cultural or religious influences discouraging alcohol use. By contrast, states across the Southeast and parts of the Mountain West—such as Utah (31.0%), Mississippi (40.5%), and West Virginia (40.9%)—report far lower rates of alcohol consumption.
When looking at changes from each state’s peak year, clear regional patterns are harder to spot—though some individual changes are striking. Significant declines have occurred in a wide range of locations, from Arizona in the Southwest (down 12.8 percentage points from its 2005 peak) to Maryland in the Mid-Atlantic (-11.1 points) and Wisconsin in the Midwest (-10.6 points). In the Northeast, Connecticut dropped 10.2 points from its peak, and Massachusetts posted the sharpest drop in the nation at 13.3 points.
Although large declines are spread across the country, one pattern stands out: Southeastern states tend to drink less overall yet are more likely to show no statistically significant change from their peak years. Alabama, Arkansas, Kentucky, South Carolina, Tennessee, and West Virginia all report stable rates, indicating that alcohol consumption in much of the region has held steady even as other parts of the country have experienced notable declines.
The tables below present a full breakdown of adult alcohol use in all 50 states, showing the share of adults who drink along with changes from each state’s peak year and over the past decade. Additional details on data sources and calculations are provided in the methodology section.
Full Results
Methodology
This analysis draws on data from the Substance Abuse and Mental Health Services Administration’s (SAMHSA) State Estimates on past-month alcohol use among adults aged 18 and older. The “share of adults who drink” reflects SAMHSA’s annual estimate of the percentage of adults reporting alcohol use in the past month during the specified survey year.
For each state, the year with the highest recorded share of adults reporting alcohol use—referred to as the peak year—was identified. The percentage-point change between that year and 2024 was calculated to show the magnitude of decline from each state’s highest level.
Because peak years differ across states, a separate 10-year comparison was conducted between 2014 and 2024 to provide an apples-to-apples view of trends over the same time period for all states. All changes were tested for statistical significance at the 90% confidence level using a z-test (threshold: z > 1.645). Instances where changes were not statistically significant are labeled as “not significant” in the data tables.