
|
SDS
|
Blogs
|
Specialty Chemicals
Posted By:
Danijel Radonjic
Workplace safety managers—often referred to as Environmental, Health, and Safety (EHS) managers—play a central role in preventing injuries, illnesses, and operational disruptions across the U.S. economy. These workers review and analyze job sites, equipment, procedures, and safety programs to identify risks and recommend ways to control or eliminate hazards. Their responsibilities can range from evaluating chemical, physical, biological, and ergonomic risks to helping employers design training programs, update workplace procedures, and comply with federal safety standards. The U.S. Bureau of Labor Statistics (BLS) defines these roles as focused on collecting data, analyzing work environments, and designing improvements to protect workers.
Their work is becoming more complex as OSHA advances regulatory changes affecting chemical hazard communication, heat illness prevention, emergency response, workplace violence, and other safety issues. For safety managers, these changes can mean more audits, revised safety plans, new training requirements, and tighter documentation demands—often across multiple facilities, departments, and regulatory jurisdictions. As a result, many employers are relying more heavily on centralized safety data sheet management, regulatory compliance tools, and other software systems to keep safety programs current, reduce manual administrative work, and enable safety managers to handle expanding workloads and responsibilities.
Researchers at Trace One—an SDS, regulatory compliance, and PLM software company serving the chemicals, food & beverage, and cosmetics sectors—analyzed BLS employment and wage data to examine how the safety workforce has changed over time, which industries rely on these workers most, how their pay compares with the broader labor market, and where safety managers oversee the largest number of employees.
Key Takeaways
- Workplace safety manager jobs are growing quickly. Employment rose 165% from 2010 to 2025, far outpacing 22% growth across all U.S. jobs.
- Demand is expected to keep rising. BLS projects occupational health and safety specialist and technician employment to grow 12% from 2024 to 2034, compared with 3% for all occupations.
- The manufacturing industry employs the most safety managers, but mining and utilities rely on them most heavily. Manufacturing employs 30,200 workplace safety managers, while mining has the highest concentration at 83.8 per 10,000 workers, followed by utilities at 52.7.
- Pay growth has lagged broader wage growth. Workplace safety manager wages rose 37.9% from 2010 to 2025, compared with 50.7% for all U.S. workers.
- Oversight burdens vary widely by location. Rhode Island has the fewest safety managers relative to its workforce—5.2 workplace safety managers per 10,000 workers—while Wyoming has the most (23.5).
- Metro rankings reflect local industry mix. Miami, FL has the fewest workplace safety professionals relative to its workforce among large metros (5.8 per 10,000 workers), while Houston, TX—with its large energy and industrial base—has the highest concentration at 21.9.
Changes in Workplace Safety Manager Employment Over Time
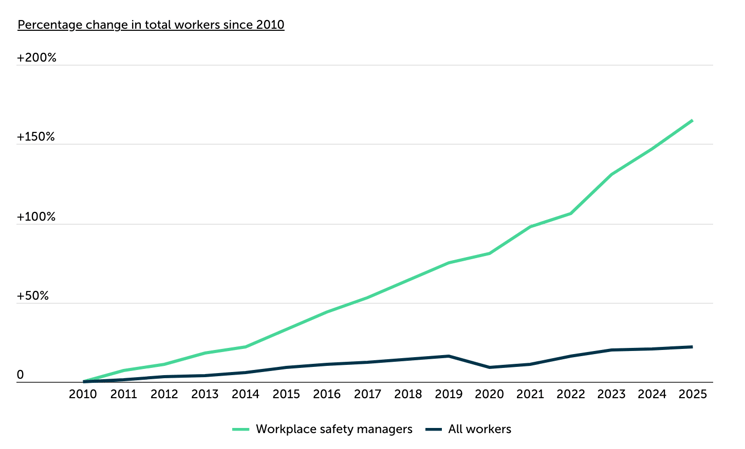
Workplace safety manager roles surged 165% since 2010, compared to just 22% for total U.S. employment
Source: Trace One analysis of U.S. Bureau of Labor Statistics data
Employment in workplace safety manager roles—defined by the BLS as occupational health and safety specialists and technicians—has grown far faster than the broader U.S. labor market over the past 15 years. From 2010 to 2025, the number of workplace safety managers increased by 165%, compared with a 22% increase in total U.S. employment. The gap was already visible before the pandemic, but it widened notably after 2020, as safety, compliance, and operational resilience became more prominent workforce priorities.
Growth in these roles also appears to have accelerated in recent years. Projections from the BLS suggest demand will continue to rise faster than the labor market overall and grow 12% from 2024 to 2034, compared with 3% growth for all occupations. The outlook is slightly stronger for specialists, whose employment is projected to grow 13% over the decade, while technician employment is projected to grow 9%. The agency also projects about 18,300 openings per year, on average, reflecting both new jobs and the need to replace workers who leave the occupation or exit the workforce.
What Industries Employ the Most Workplace Safety Managers?
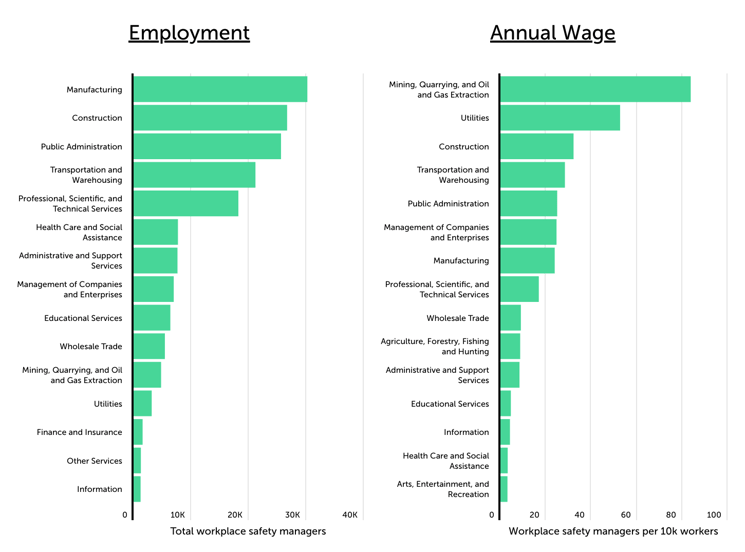
Manufacturing and construction employ the most safety managers, but the highest concentrations are found in mining and utilities
Source: Trace One analysis of U.S. Bureau of Labor Statistics data
Workplace safety managers are most numerous in large, labor-intensive sectors with complex operating environments. Manufacturing employs the largest number of these workers, with 30,200 workplace safety managers, followed by construction with 26,680, public administration with 25,620, and transportation and warehousing with 21,180. These industries typically involve a combination of physical worksites, machinery, vehicles, hazardous materials, or public-facing infrastructure, all of which can require formal safety programs, training, inspections, and ongoing compliance work.
A different pattern emerges when accounting for industry size. The highest concentrations of workplace safety managers are in mining, quarrying, and oil and gas extraction, with 83.8 safety managers per 10,000 workers, and utilities, with 52.7. Construction ranks third by concentration, at 32.2 per 10,000 workers, followed by transportation and warehousing at 28.4. This suggests that while manufacturing and construction employ the most safety managers overall, smaller high-risk sectors such as mining and utilities rely on them more heavily relative to the size of their workforces—an important distinction as safety teams are asked to manage more documentation, training, inspections, and regulatory compliance updates without necessarily seeing staffing grow at the same pace.
How PLM Supports Workplace Safety
PLM software centralizes product and supplier data that feeds safety data sheets, hazard communication, and regulatory documentation—giving safety teams a single source of truth instead of siloed spreadsheets and supplier emails.

Workplace Safety Manager Wages Compared to the U.S. Average
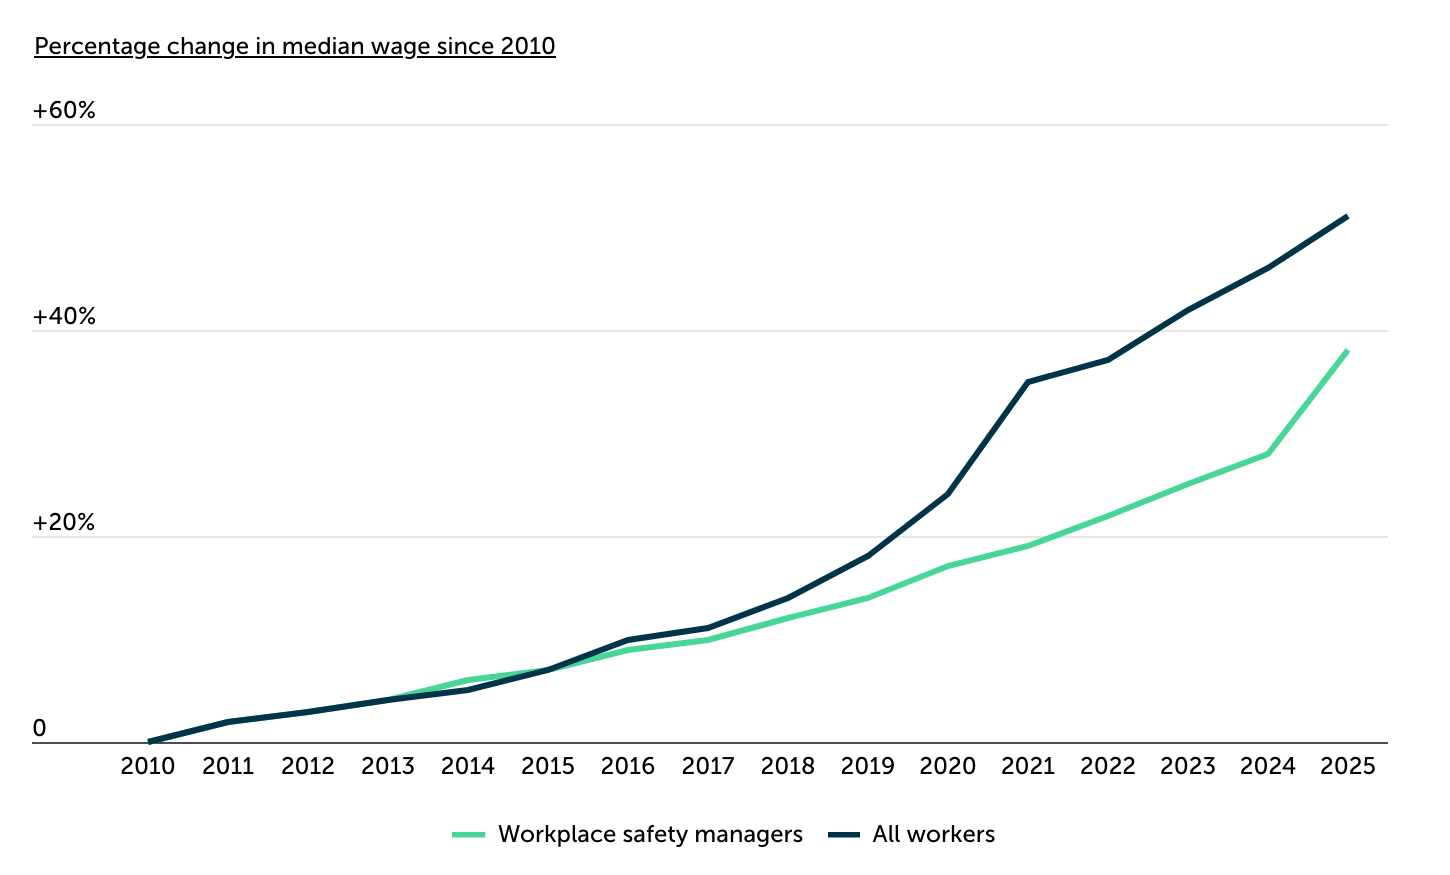
Safety manager wage growth trails the national average despite recent progress
Source: Trace One analysis of U.S. Bureau of Labor Statistics data
Wages for workplace safety managers have risen steadily since 2010, but they have not kept pace with wage growth across the broader labor market. By 2025, workplace safety manager wages were 37.9% higher than in 2010, compared with a 50.7% increase for all U.S. workers. The gap began to widen after 2015, as average wages nationally grew more quickly than pay in safety roles.
The difference was especially pronounced during and after the pandemic, when overall wage growth accelerated across the economy. From 2020 to 2025, wages for all workers rose from 24.0% above 2010 levels to 50.7%, while workplace safety manager wages increased from 17.1% to 37.9%. Although safety manager pay growth improved in 2025, the longer-term trend suggests that compensation has lagged despite rising demand for these workers and a growing compliance burden.
Where Do Workplace Safety Managers Oversee the Safety of the Most Employees?
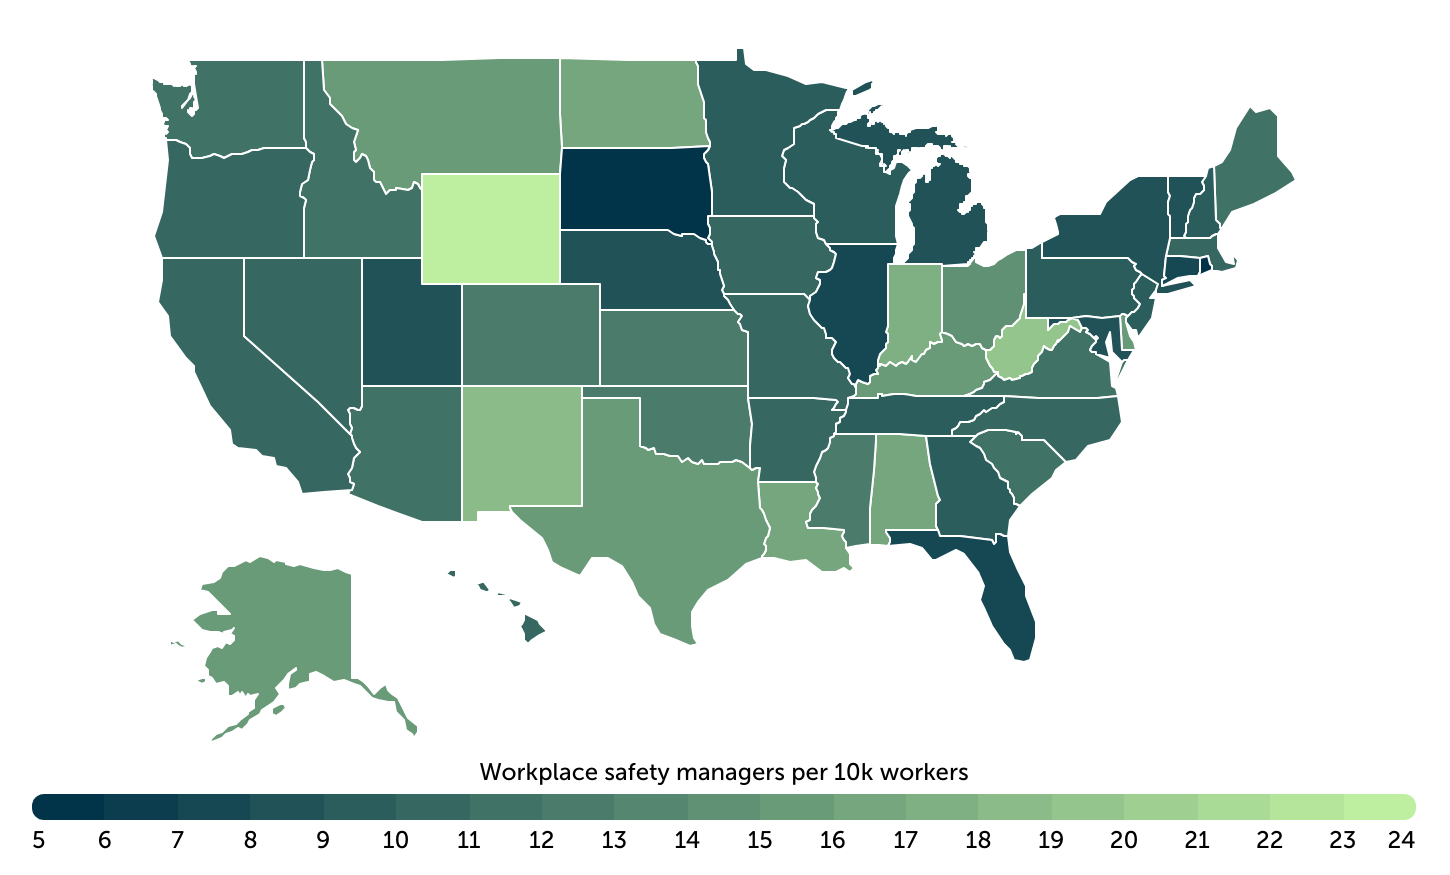
Rhode Island workplace safety managers have the highest oversight burden
Source: Trace One analysis of U.S. Bureau of Labor Statistics data
Despite growing demand and strong hiring projections for workplace safety managers, staffing levels vary substantially by location. Rhode Island has the lowest concentration of workplace safety managers, with just 5.2 per 10,000 workers—meaning each safety manager oversees a larger employee base than in any other state. South Dakota follows at 5.5, while Connecticut (7.2), Illinois (7.7), and Florida (7.8) also have relatively few safety managers for the size of their workforces.
At the other end of the spectrum, Wyoming has 23.5 workplace safety managers per 10,000 workers, followed by West Virginia (19.1) and New Mexico (18.7). The divide likely reflects differences in each state’s labor market. States with more concentrated industrial, energy, extraction, or production activity tend to have more dedicated safety staff, while states with larger service-oriented workforces often have fewer safety managers relative to total employment. But lower-risk does not mean risk-free: offices, hospitals, schools, hotels, restaurants, warehouses, and public agencies all still require safety programs, training, documentation, and compliance oversight.
Metro-level rankings show the same pattern in sharper detail. Among large metros, Miami, FL has the highest oversight burden, with just 5.8 workplace safety managers per 10,000 workers, followed by Washington, D.C. (6.9); New York, NY (7.5); and Tampa, FL (7.7). These are large, diversified labor markets where safety responsibilities are spread across broad service, government, health care, tourism, and professional employment bases. By contrast, safety manager concentrations are much higher in metros with more specialized industrial footprints. Houston has 21.9 safety managers per 10,000 workers, the highest among large metros, while smaller energy and petrochemical hubs such as Midland (51.6) and Odessa (43.3) in Texas, or Lake Charles (27.5) and Baton Rouge (24.2) in Louisiana, also have some of the largest concentrations among their respective population cohorts. The metro data suggest that workplace safety staffing is not simply a function of population or job count; it is closely tied to the type of work being done and the level of day-to-day compliance risk employers need to manage.
A full analysis of workplace safety manager oversight burdens in nearly 300 metropolitan areas and all 50 states can be found below. For more information regarding the data sources and calculations, see the methodology section.
Full Results
Methodology
Researchers at Trace One analyzed the latest data from the U.S. Bureau of Labor Statistics’ 2025 Occupational Employment and Wage Statistics series. To calculate the locations with the highest oversight burdens for workplace safety managers, the researchers divided the total number of workplace safety managers by the total number of employees and normalized per 10,000 employees for readability. Workplace safety managers were defined as the combination of Occupational Health and Safety Specialists and Occupational Health and Safety Technicians, using the Standard Occupational Classification (SOC) codes 19-5011 and 19-5012, respectively.
For additional context, the researchers also calculated the total workplace safety managers in both 2025 and 2022, the percentage change in workplace safety managers from 2022 to 2025, and the median annual wage. Percentage change values were tested for statistical significance using a 90% confidence level.
Only locations with complete data were included, and metropolitan areas were grouped in the following population cohorts for relevance:
Large: more than 1,000,000
Midsize: between 350,000 and 999,999
Small: less than 350,000